

Otonomo recently co-hosted a webinar with xyzt.ai, a visual analytics platform to gain insight from location and traffic data. Bart Adams, CTO of xyzt.ai, kicked off the webinar by explaining the value of traffic data analysis in managing traffic congestion.
Taking a Deep Dive Into LA Traffic
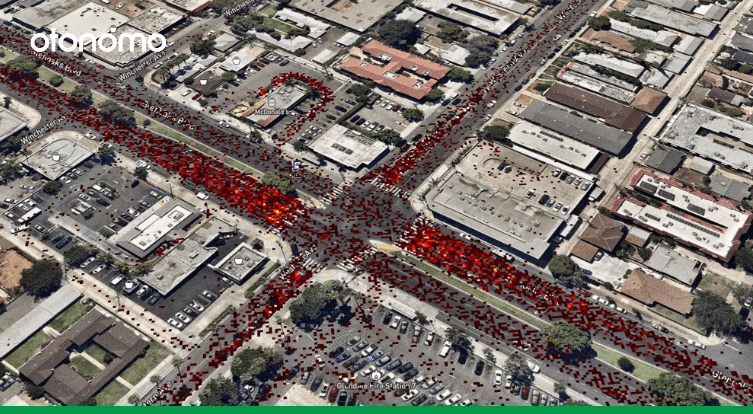
To illustrate the value of vehicle traffic data on traffic management, Adams focused on Los Angeles for much of the webinar. Notorious for terrible traffic, Los Angeles uses an intelligent transport system (ITS) which leverages real-time traffic data from nearly 4,600 signalized intersections. The ITS has had an impact: travel time was decreased by 12% and speeds increased by 16%.
Adams pointed out that with connected cars, every car is a sensor with the ability to transmit real-time traffic data. LA, a massive metropolis with over 8M cars, performs only 6000 annual traffic counts. He then highlighted the significant potential benefits from using connected vehicle data for traffic management, among them fewer logistical problems and lower costs than infrastructure sensors.
5 Tips to be a Traffic Data Analyst Rockstar
Smart analysts need great tools and accurate data. Read on to learn how to put the two together to make an impact.
| Tip | Your Impact |
|---|---|
| 1. Choose traffic data that moves within the traffic flow |
|
| 2. Use high quality automotive data |
|
| 3. Explore traffic data visually |
|
| 4. Extract more and smarter insights from traffic data analysis |
|
| 5. Share and collaborate |
|

1. Choose Traffic Data That Moves Within the Traffic Flow
Traffic data analysts can start thinking about traffic like the mathematician Joseph-Louis Lagrange. He said the best way to measure and analyze traffic flow was from a position within.
Traffic cameras and sensors are stationary, but connected vehicles are inside of the flow of traffic: they experience motion, stopping, speed, and other factors in real-time as part of the aggregate.
Every car is a sensor, making real-time traffic data available wherever there are cars. By using automotive data to move within the flow of traffic, one can analyze any area, any street, in any environment at any time of day.
2. Use High Quality Automotive Data
The quality of the data input affects the quality of the data output – for better or for worse.
High-quality vehicle data should be:
Standardized: Vehicle data is labeled and defined differently by each OEM, and by each make and vehicle model. Different metrics and parameters are used, creating the need for a “translator” for any meaningful data analysis. It is essential to ensure that data is standardized before starting a traffic analysis.
Harmonized: For vehicle data to be useful it needs to be harmonized, meaning that it should pass through the following processes: consolidation, normalization and enrichment.
Cleansed: Like any data, there are instances in which there are abnormalities in vehicle data. The best analyses start with data that has already been quality controlled, so “dirty data” doesn’t slow down or compromise insights.
Rich: Data with multiple attributes is key for meaningful traffic analysis. Vehicle data is extremely rich, meaning analysts can work with more than just traffic counts or time stamps.
Compliant: It is vital to use vehicle data that is compliant with local regulations. In most cases, aggregate traffic data must be properly anonymized.
3. Explore Traffic Data Visually
Before building models, machine learning algorithms or statistical analyses, the best data analysts explore data visually. When it comes to traffic data, starting an analysis with a heatmap offers many more insights than a spreadsheet.
There are many benefits to visual analysis of traffic data:
Big Data Digestibility: Vehicle traffic data has billions of data points over hundreds of attributes. Visualizations make it easy to see patterns and know where to focus.
Spatial-Temporal Analysis: Traffic data is 4D, so a visualization can show you traffic patterns over time. In the below map of Munich, data is presented spatially as well as on a timeline, and can be filtered based on timestamps.
Attribute Filters: An analyst can also filter vehicle data by vehicle attributes, such as speed or volume. This gives a nuanced view of traffic congestion, route mapping, or road hazards, such as heavy rain.
Specified Areas of Interest: A visual representation allows traffic analysts to identify and zoom in on areas of interest. By starting with a map of a larger area, it is easy to see which areas contain anomalies in traffic, high congestion areas, or other factors, and zoom in to view more granular detail of those areas.
Context: Visual representations can give context to data analysis for faster insights. Seeing traffic on a map allows an analyst to quickly see that an area with high speeds is a freeway, or that a locale with a high concentration of cars is a downtown neighborhood.
4. Extract More and Smarter Insights From Traffic Data
Using vehicle data helps to extract deep insights, and visualization tools allow for quicker, more nuanced and contextualized analysis.
Here are a few tips that traffic analysts can use to make smarter insights:
See the larger context: Vehicle traffic data is unique in that you can use it to see multiple areas, even multiple cities. The visualization below shows traffic patterns for the entirety of the state of California. This kind of macro view allows for a broader context and easy comparative analysis.
Zoom In: Zoom in on points of interest to gain specialized insights. Xyzt.ai allows you not only to zoom in, but also to select specific areas on which to focus.
Compare: Compare an area with itself over time, across different attributes, or even on street direction to deliver meaningful analysis on traffic flow. Make comparisons of multiple areas to analyze congestion factors, location specifics, and more.
Use multiple attributes: Automotive data is rich with different attributes like location, volume, speed, ultrasonic data and more. Visualization allows you to filter layers of data for a holistic understanding.
5. Share and Collaborate
A rockstar traffic data analyst is one who knows that they don’t hold all the answers, and is keen to collaborate with managers, peers, and stakeholders. Further analysis and feedback is valuable for complex traffic analysis, and the right data visualization tool will make sharing dashboards and analyses easy.
Get Started Today!
Test drive a 30-day free trial of our self-serve platform to see how aggregate traffic data can fuel your traffic data analysis.


